Loading Libraries and Data
Data Preparation
set.seed(123)
data <- data |>
  mutate( # calculating average deaths for sizing
    avg_deaths = (war_deaths_low + war_deaths_high) / 2,
    deaths_millions = avg_deaths / 1000000,
    war_type = ifelse(civil_war == "Civil war", "CIVIL WARS", "INTERSTATE WARS"),
    war_type = factor(war_type, levels = c("INTERSTATE WARS", "CIVIL WARS")),

    y_manual = case_when( # here i manually assign a 'y_manual' value to each war to ensure exact spread, each war gets a specific y-coordinate (0-10 scale)

  # INTERSTATE WARS (positioned around y = 4.0)
  war_name == "Second Maratha War" ~ 4.17,
  war_name == "Napoleonic Wars" ~ 4.7,
  war_name == "Anglo-Turkish War" ~ 3.95,
  war_name == "Russo-Turkish War" ~ 3.67,
  war_name == "Russo-Persian War" ~ 4.17,

  war_name == "War of 1812" ~ 4.0,
  war_name == "Wahhabi War" ~ 4.3,
  war_name == "Neapolitan War" ~ 3.87,
  war_name == "Gurkha War" ~ 4.1,
  war_name == "Bombardment of Algiers" ~ 4.0,
  war_name == "Third Maratha War" ~ 4.15,
  war_name == "Durrani Empire-Sikh War" ~ 3.7,
  war_name == "Fifth Cape Frontier War" ~ 4.0,

  war_name == "Turko Persian War" ~ 4.0,
  war_name == "Ashanti-British War" ~ 4.15,
  war_name == "First Anglo-Burmese War" ~ 3.78,
  war_name == "Siege of Bharatpur" ~ 4.0,
  war_name == "Argentine-Brazilian War" ~ 4.15,
  war_name == "Vientiane-Siam War" ~ 3.6,
  war_name == "Second Russo-Persian War" ~ 3.9,
  war_name == "Russo-Turkish War of 1828-29" ~ 4.3,
  war_name == "Gran Colombia-Peru War" ~ 4.05,
  war_name == "French-Algerian War" ~ 4.0,

  war_name == "Siamese-Vietnamese War" ~ 4.0,
  war_name == "Afghan-Sikh War" ~ 4.0,
  war_name == "Afghan-Persian War" ~ 3.78,
  war_name == "War of the Confederation" ~ 4.17,
  war_name == "First Opium War" ~ 4.23,
  war_name == "Bolivia-Peru War" ~ 4.0,
  war_name == "Sino-Sikh War" ~ 3.78,
  war_name == "Siamese-Vietnamese War II" ~ 4.35,
  war_name == "Gwalior War" ~ 4.1,
  war_name == "Anglo-Baluch War" ~ 3.8,
  war_name == "Franco-Moroccan War" ~ 4.0,

  war_name == "Mexican-American War" ~ 3.78,
  war_name == "Second Dominican War" ~ 4.23,
  war_name == "Seventh Cape Frontier War" ~ 4.0,
  war_name == "First Anglo-Sikh War" ~ 3.53,
  war_name == "Austro-Sardinian War of 1848" ~ 4.33,
  war_name == "First Schleswig-Holstein War" ~ 4.0,
  war_name == "First Egba-Dahomey War" ~ 3.8,
  war_name == "Eighth Cape Frontier War" ~ 4.0,
  war_name == "La Plata War" ~ 4.23,
  war_name == "Tukolor-Tamba War" ~ 4.1,
  war_name == "Crimean War" ~ 4.6,
  war_name == "Tukolor-Bambara War of 1855" ~ 4.2,
  war_name == "Tibet-Nepalese War" ~ 3.75,
  war_name == "Fourth Dominican War" ~ 3.95,
  war_name == "Central American National War" ~ 4.25,
  war_name == "Anglo-Persian War" ~ 4.03,
  war_name == "Franco-Tukulor War" ~ 4.23,
  war_name == "Second Opium War" ~ 4.03,
  war_name == "Hispano-Moroccan War" ~ 3.78,
  war_name == "Two Sicilies Insurrection" ~ 4.2,
  war_name == "Papal States War" ~ 4.0,
  war_name == "Tukulor-Bambara War of 1860" ~ 4.43,

  war_name == "Central American War" ~ 4.2,
  war_name == "Ecuadorian-Colombian War" ~ 4.0,
  war_name == "Second Schleswig-Holstein War" ~ 3.67,
  war_name == "Second Egba-Dahomey War" ~ 4.04,
  war_name == "Franco-Mexican War" ~ 3.4,
  war_name == "Russia-Khokandian War" ~ 3.87,
  war_name == "Sino-Kuchean Muslim War" ~ 4.23,
  war_name == "Sino-Khokandian War" ~ 4.06,
  war_name == "Russia-Bukhara Khanate War" ~ 3.77,
  war_name == "Austro-Prussian War" ~ 3.5,
  war_name == "Paraguayan War" ~ 4.2,
  war_name == "British Abyssinian Expedition" ~ 3.8,
  war_name == "Franco-Prussian War" ~ 4.5,
  war_name == "Sino-Jahriyya Order War" ~ 3.55,
  war_name == "Ottoman Conquest of Arabia" ~ 3.8,
  war_name == "Kashgaria-Urumchi Dungan War" ~ 4.05,

  war_name == "Anglo-Ashanti War" ~ 4.17,
  war_name == "Egypt-Abyssinian War" ~ 3.55,
  war_name == "Russia-Khokand Khanate War" ~ 4.2,
  war_name == "First Central American War" ~ 4.0,
  war_name == "Sino-Kashgarian War" ~ 3.8,
  war_name == "Russo-Turkish War of 1877-78" ~ 4.3,
  war_name == "Ninth Cape Frontier War" ~ 4.0,
  war_name == "British-Zulu War" ~ 3.77,
  war_name == "Second Anglo-Afghan War" ~ 4.23,
  war_name == "Russo-Turkomen War" ~ 4.0,

  war_name == "War of the Pacific" ~ 3.77,
  war_name == "Anglo-Egyptian War" ~ 4.0,
  war_name == "Sino-French (Tonkin) War" ~ 4.15,
  war_name == "Second Central American War" ~ 4.0,
  war_name == "Serbo-Bulgarian War" ~ 4.2,
  war_name == "Ethiopian-Mahdi War" ~ 3.73,
  war_name == "War of Dogali" ~ 4.0,
  war_name == "Mahdi-Egyptian War" ~ 4.0,

  war_name == "Franco-Dahomean War" ~ 4.1,
  war_name == "Franco-Mandingo War V" ~ 4.0,
  war_name == "Congo Arab War" ~ 4.37,
  war_name == "Bornu Empire-Rabah Empire War" ~ 3.75,
  war_name == "France-Tukolor Empire War" ~ 4.05,
  war_name == "Melilla War" ~ 4.2,
  war_name == "Mahdist-Italian War" ~ 3.9,
  war_name == "First Matabele War" ~ 4.1,
  war_name == "First Sino-Japanese War" ~ 3.9,
  war_name == "Japanese Invasion of Taiwan" ~ 4.3,
  war_name == "Portugal-Gaza Nguni War" ~ 4.1,
  war_name == "Second Franco-Hova War" ~ 4.01,
  war_name == "First Italo-Abyssinian War" ~ 3.73,
  war_name == "British-Mahdi War" ~ 3.85,
  war_name == "Spanish-American War" ~ 4.15,
  war_name == "Franco-Mandingo War VIII" ~ 4.07,
  war_name == "Second Anglo-Boer War" ~ 4.2,
  war_name == "War of the Golden Stool" ~ 4.27,
  war_name == "British-Sokoto Caliphate War" ~ 3.8,
  war_name == "Franco-Rabah Empire War" ~ 4.0,

  war_name == "Boxer Rebellion" ~ 4.05,
  war_name == "Russo-Japanese War" ~ 4.3,
  war_name == "Third and Fourth Central American War" ~ 4.05,
  war_name == "Second Spanish-Moroccan War" ~ 4.15,
  war_name == "Greco-Turkish War" ~ 3.8,
  war_name == "Wadai War" ~ 4.0,
  war_name == "Italo-Turkish War" ~ 4.15,
  war_name == "Second Balkan War" ~ 3.7,
  war_name == "First Sino-Tibet War" ~ 4.0,

  war_name == "World War I" ~ 1.65,
  war_name == "Second Sino-Tibet War" ~ 4.0,
  war_name == "Polish-Ukrainian War" ~ 4.5,
  war_name == "Czech-Polish War" ~ 4.3,
  war_name == "Hungarian Adversaries War" ~ 3.75,
  war_name == "Third Anglo-Afghan War" ~ 4.1,
  war_name == "Soviet-Polish War" ~ 3.5,
  war_name == "Waziristan Campaign" ~ 4.0,
  war_name == "Franco-Turkish War" ~ 4.2,
  war_name == "Turkish-Armenian War" ~ 3.8,
  war_name == "Azeri-Armenian War" ~ 4.1,
  war_name == "Polish-Lithuanian War" ~ 4.0,
  war_name == "Soviet-Georgia War" ~ 3.7,
  war_name == "Hejaz War" ~ 4.0,

  war_name == "Second Sino-Japanese War" ~ 4.4,
  war_name == "Third Sino-Japanese War" ~ 2.85,
  war_name == "World War II" ~ 7.9,
  war_name == "Sino-Soviet War" ~ 4.0,
  war_name == "Chaco War" ~ 3.7,
  war_name == "East Turkestan Kashgar War" ~ 4.25,
  war_name == "Saudi-Yemeni War" ~ 4.01,
  war_name == "Second Italo-Abyssinian War" ~ 3.9,
  war_name == "Battle of Lake Khasan" ~ 4.01,
  war_name == "Battle of Khalkhin Gol" ~ 4.2,
  war_name == "Peruvian-Ecuadorian War" ~ 4.0,
  war_name == "East Turkestan Gulja Incident" ~ 4.0,
  war_name == "India-Pakistan War of 1947" ~ 4.0,
  war_name == "Operation Polo" ~ 4.2,
  war_name == "1948 Palestine War" ~ 3.8,
  war_name == "Korean War" ~ 4.6,
  war_name == "Suez Crisis" ~ 3.95,
  war_name == "Second Taiwan Strait Crisis" ~ 4.09,

  war_name == "Sino-Indian War" ~ 3.95,
  war_name == "India-Pakistan War of 1965" ~ 3.95,
  war_name == "Six Day War" ~ 3.95,
  war_name == "Vietnam War" ~ 3.22,
  war_name == "Football War" ~ 3.95,
  war_name == "War of Attrition" ~ 4.09,
  war_name == "Yom Kippur War" ~ 4.0,
  war_name == "North Vietnam-South Vietnam War" ~ 4.25,
  war_name == "Vietnamese-Cambodian War" ~ 4.0,
  war_name == "Uganda-Tanzania War" ~ 4.09,
  war_name == "First Sino-Vietnamese War" ~ 3.8,
  war_name == "Yemen Border War II" ~ 4.0,
  war_name == "Falklands War" ~ 4.0,
  war_name == "Lebanese War of 1982-84" ~ 4.09,
  war_name == "Iran-Iraq War" ~ 3.6,
  war_name == "Toyota War" ~ 4.1,
  war_name == "Second Sino-Vietnamese War" ~ 4.0,
  war_name == "Iraq-Kuwait War" ~ 4.0,
  war_name == "Persian Gulf War" ~ 4.25,
  war_name == "Nagorno-Karabakh War" ~ 4.0,
  war_name == "US-Afghan" ~ 4.25,
  war_name == "Ethiopian-Eritrean War" ~ 3.7,
  war_name == "Kargil Conflict" ~ 4.0,
  war_name == "US-Iraq War" ~ 4.0,
  war_name == "Israel-Hezbollah War" ~ 4.0,

  # CIVIL WARS (positioned around y = 5.0)
  war_name == "Argentine War of Independence" ~ 5.0,
  war_name == "Venezuelan War of Independence" ~ 5.3,
  war_name == "Chilean War of Independence" ~ 5.0,
  war_name == "Ecuadorian War of Independence" ~ 5.0,
  war_name == "Peruvian War of Independence" ~ 4.8,
  war_name == "Brazilian War of Independence" ~ 5.2,
  war_name == "November Uprising" ~ 5.3,
  war_name == "Second Turko-Egyptian War" ~ 5.0,
  war_name == "Farroupilha Revolution" ~ 5.3,
  war_name == "First Anglo-Afghan War" ~ 4.8,
  war_name == "Hungarian War of Independence" ~ 4.52,
  war_name == "War of the Roman Republic" ~ 5.3,
  war_name == "Montenegrin-Ottoman War" ~ 4.86,
  war_name == "Indian Rebellion of 1857" ~ 5.3,
  war_name == "Austro-Sardinian War of 1859" ~ 4.9,
  war_name == "Nien (Nian) Rebellion" ~ 5.2,
  war_name == "Taiping Rebellion" ~ 4.1,
  war_name == "American Civil War" ~ 4.7,
  war_name == "Boshin War" ~ 4.9,
  war_name == "Satsuma Rebellion" ~ 5.47,
  war_name == "Thousand Days' War" ~ 5.45,
  war_name == "Xinhai Revolution" ~ 5.0,
  war_name == "Finnish Civil War" ~ 5.0,
  war_name == "Lithuanian-Soviet War" ~ 5.35,
  war_name == "Latvian War of Independence" ~ 4.73,
  war_name == "Estonian War of Independence" ~ 4.35,
  war_name == "Russian Civil War" ~ 6.85,
  war_name == "Warlord Era Wars" ~ 6.15,
  war_name == "Spanish Civil War" ~ 5.0,
  war_name == "Chinese Civil War" ~ 5.0,
  war_name == "Nigerian-Biafran War" ~ 4.9,
  war_name == "Black September War of 1970" ~ 4.9,
  war_name == "Bangladesh War" ~ 5.15,
  war_name == "Ogaden War" ~ 4.95,
  war_name == "Angolan Civil War" ~ 5.85,
  war_name == "Dniestrian Independence War" ~ 5.27,
  war_name == "Bosnian War" ~ 4.4,
  war_name == "Rwanda War 1994" ~ 5.5,
  war_name == "Yemen Civil War" ~ 5.15,
  war_name == "Second Congo War" ~ 5.3,
  war_name == "Sri Lanka-Tamil War II" ~ 5.37,

  war_type == "INTERSTATE WARS" ~ runif(n(), 3.85, 4.15), # default y-position for interstate wars
  war_type == "CIVIL WARS" ~ runif(n(), 4.85, 5.15), # default y-position for civil wars
  TRUE ~ 5.0
),


    y_plot = scales::rescale(y_manual, to = c(0.5, 1.5), from = c(0, 10)), # rescale: convert 0-10 scale to 0.5-1.5 for plotting
    x_plot = midpoint # x-coordinate is the midpoint of war years (variable from dataset)
)

data <- data |>
  mutate(
    region = recode(region,
                    "Cross-Regional" = "Multiple regions",
                    "North Africa and Middle East" = "North Africa & Middle East")
  )

max_deaths <- max(data$avg_deaths)
min_deaths <- min(data$avg_deaths)
Details for Visualization (Colors, Fonts and Labels)
region_colors <- c(
  "Multiple regions" = "#AF1B45",
  "Americas" = "#E46E5A",
  "Asia" = "#58AB8B",
  "Europe" = "#FAAF3B",
  "North Africa & Middle East" = "#79B6F2",
  "Sub-Saharan Africa" = "#4C6A9B"
)

font_add_google("Castoro", "Castoro")
 # custom font from google fonts

showtext_auto()

# manual positioning for labels (INTERSTATE)
interstate_labels <- tribble(
  ~war_name, ~label_y, ~formatted_name,
  "Napoleonic Wars", 5.7, "Napoleonic Wars",
  "Crimean War", 5.5, "Crimean War",
  "Korean War", 1.5, "Korean War",
  "Suez Crisis", 3.0, "Suez Crisis",
  "Vietnam War", 1.0, "Vietnam War",
  "Yom Kippur War", 5.3, "Yom Kippur War",
  "Iran-Iraq War", 2.0, "Iran-Iraq War",
  "Persian Gulf War", 5.8, "Persian Gulf War",
  "Ethiopian-Eritrean War", 1.5, "Ethiopian-\nEritrean War",  # line break
  "Third Sino-Japanese War", 0.2, "Second Sino-\nJapanese War"  # renamed (error in dataset) + line break
) |>
  left_join(data |> select(war_name, x_plot, war_deaths_low, war_deaths_high), # add death range estimate
            by = "war_name") |>
  mutate(
    # use formatted_name in label
    label_text = ifelse(
      war_name == "Third Sino-Japanese War",
      paste0(formatted_name, "\n",
             floor(war_deaths_low/1000000 * 10) / 10, "–",
             floor(war_deaths_high/1000000 * 10) / 10, "m"), # death range in millions
      paste0(formatted_name, "\n",
             floor(war_deaths_low/1000), "–",
             floor(war_deaths_high/1000), "k")  # death range in thousands
    ),
    label_y_plot = scales::rescale(label_y, to = c(0.5, 1.5), from = c(0, 10)) # rescaling
  )

# manual positioning for labels (CIVIL)
civil_labels <- tribble(
  ~war_name, ~label_y, ~formatted_name,
  "Venezuelan War of Independence", 7.2, "Venezuelan War\nof Independence",
  "American Civil War", 2.6, "American Civil War",
  "Russian Civil War", 9.2, "Russian Civil War",
  "Warlord Era Wars", 3.5, "Warlord Era Wars",
  "Spanish Civil War", 6.7, "Spanish Civil War",
  "Chinese Civil War", 1.8, "Chinese Civil War",
  "Angolan Civil War", 7.6, "Angolan Civil War",
  "Bosnian War", 1.6, "Bosnian War"
) |>
  left_join(data |> select(war_name, x_plot, war_deaths_low, war_deaths_high), # also add death estimate range
            by = "war_name") |>
  mutate(
    label_text = ifelse(
      war_name == "Chinese Civil War",
      paste0(formatted_name, "\n",
             floor(war_deaths_low/1000000 * 10) / 10, "–",
             floor(war_deaths_high/1000000 * 10) / 10, "m"),
      paste0(formatted_name, "\n",
             floor(war_deaths_low/1000), "–",
             floor(war_deaths_high/1000), "k")
    ),
    label_y_plot = scales::rescale(label_y, to = c(0.5, 1.5), from = c(0, 10)) # rescaling
  )
Create the Plot
graph_interstate <- data |>
  filter(war_type == "INTERSTATE WARS") |>
  ggplot(aes(x = x_plot, y = y_plot)) +

  # lines connecting circles to external labels (added first so that they appear behind the circles)
  geom_segment(
    data = interstate_labels |>
      left_join(data |>
                  select(war_name, y_plot), by = "war_name"),
    aes(x = x_plot,
        y = y_plot,
        xend = x_plot,
        yend = label_y_plot),
    color = "gray40",
    linewidth = 0.3
  ) +

  # plot the circles that represent wars
  geom_point(aes(size = avg_deaths,
                 color = region),
             alpha = 1) +

  # white labels for WWI and WWII (inside the circles)
  geom_text(
    data = data |> filter(war_name %in% c("World War II", "World War I")),
    aes(label = paste0(war_name, "\n",
                       floor(war_deaths_low/1000000 * 10) / 10, "–",
                       floor(war_deaths_high/1000000 * 10) / 10, "m deaths")),
    size = 2.7,
    color = "white",
    fontface = "bold",
    lineheight = 0.9
  ) +

  # labels outside the circles for other wars
  geom_text(
    data = interstate_labels,
    aes(x = x_plot, y = label_y_plot, label = label_text),
    size = 2.9,
    color = "black",
    lineheight = 0.9
  ) +

  # "INTERSTATE WARS" panel title at top
  annotate("text",
           x = 1800,
           y = 1.55,
           label = "INTERSTATE WARS",
           size = 5,
           fontface = "bold",
           hjust = 0) + # left-side

  scale_color_manual(values = region_colors,
                     name = NULL,
                     breaks = names(region_colors)) +

  # circle area proportional to value
  scale_size_area(max_size = 82,
                limits = c(min(data$avg_deaths),
                           max(data$avg_deaths)),
                guide = "none") +

  scale_x_continuous(limits = c(1800, 2015), # x-axis scale
                     breaks = c(seq(1800, 2000, by = 20),
                                2011), # marks every 20 years (+ 2011)
                     expand = c(0.01, 0),
                     position = "bottom") +  # timeline at bottom of this panel
  scale_y_continuous(limits = c(0.4, 1.6), # y-axis scale
                     expand = c(0, 0)) +

  labs(title = "Combatant deaths in conventional wars, 1800–2011",
       subtitle = "Number of combatants who died due to fighting in interstate and civil wars. This excludes civilian deaths, which can\nmake the death tolls much larger.",
       x = NULL, y = NULL) +

  theme_minimal() +
  theme(
    panel.background = element_rect(fill = "#faf8f2", color = NA),
    plot.background = element_rect(fill = "#faf8f2", color = NA),
    panel.grid.major.y = element_blank(),
    panel.grid.minor = element_blank(),
    panel.grid.major.x = element_line(color = "gray90", linewidth = 0.3),
    axis.text.x = element_text(size = 11),  # show x-axis numbers here (timeline)
    axis.text.y = element_blank(), # no y-axis numbers
    axis.ticks = element_blank(),
    plot.title = element_text(size = 24, face = "bold", # font for title
                            family = "Castoro",
                            margin = margin(b = 5)),

  plot.subtitle = element_text(size = 14, color = "gray30", # font for subtitle
                               family = "Castoro",
                               margin = margin(b = 15)),
  plot.margin = margin(10, 10, 10, 10),
    legend.position = "top",
    legend.justification = "left",
    legend.direction = "horizontal",
    legend.text = element_text(size = 10)
  ) +

  # region legend
  guides(color = guide_legend(
    override.aes = list(shape = 15, # show colors as squares
                        size = 4.7),
    nrow = 1
  ))

graph_civil <- data |>
  filter(war_type == "CIVIL WARS") |>
  ggplot(aes(x = x_plot, y = y_plot)) +

  geom_segment(
    data = civil_labels |>
      left_join(data |> select(war_name, y_plot), by = "war_name"),
    aes(x = x_plot, y = y_plot, xend = x_plot, yend = label_y_plot),
    color = "gray40",
    size = 0.3
  ) +

  geom_point(aes(size = avg_deaths, color = region), alpha = 1) +

  geom_text(
    data = civil_labels,
    aes(x = x_plot, y = label_y_plot, label = label_text),
    size = 2.9,
    color = "black",
    lineheight = 0.9
  ) +

  annotate("text", x = 1800, y = 1.55, label = "CIVIL WARS",
           size = 5, fontface = "bold", hjust = 0) +

  scale_color_manual(values = region_colors, name = NULL,
                     breaks = names(region_colors)) +
  scale_size_area(max_size = 80,
                limits = c(min(data$avg_deaths), max(data$avg_deaths)),
                guide = "none") +

  scale_x_continuous(limits = c(1800, 2015),
                     breaks = c(seq(1800, 2000, by = 20), 2011),
                     expand = c(0.01, 0)) +
  scale_y_continuous(limits = c(0.4, 1.6), expand = c(0, 0)) +

  labs(x = NULL, y = NULL,  # remove axis labels
       caption = "Note: Each circle is sized according to the war's lower death estimate. A conventional war is defined here as an armed conflict fought with differentiated militaries and clear frontlines that\ncaused at least 500 combatant deaths due to fighting over its duration. A civil war is a conflict between combatants that were previously part of the same state, with at least one group now\nseeking control or secession.\nSources: Lyall, Jason. 2020. Divided Armies: Inequality and Battlefield Performance in Modern War. Princeton University Press.\nOurWorldInData.org — Research and data to make progress against the world's largest problems. Licensed under CC-BY by the authors Bastian Herre, Christian Schwinehart and Klara Auerbach.")  +

  theme_minimal() +
  theme(
    panel.background = element_rect(fill = "#faf8f2", color = NA),
    plot.background = element_rect(fill = "#faf8f2", color = NA),
    panel.grid.major.y = element_blank(),
    panel.grid.minor = element_blank(),
    panel.grid.major.x = element_line(color = "gray90", size = 0.3),
    axis.text.x = element_blank(),  # no timeline here
    axis.text.y = element_blank(),
    axis.ticks = element_blank(),
    plot.caption = element_text(size = 9.7, color = "gray50", hjust = 0, margin = margin(t = 15)),
    plot.margin = margin(10, 10, 10, 10),
    legend.position = "none"
  )

# combine interstate wars + civil wars
combined_graph <- graph_interstate / graph_civil +
  plot_layout(heights = c(7, 3))

combined_graph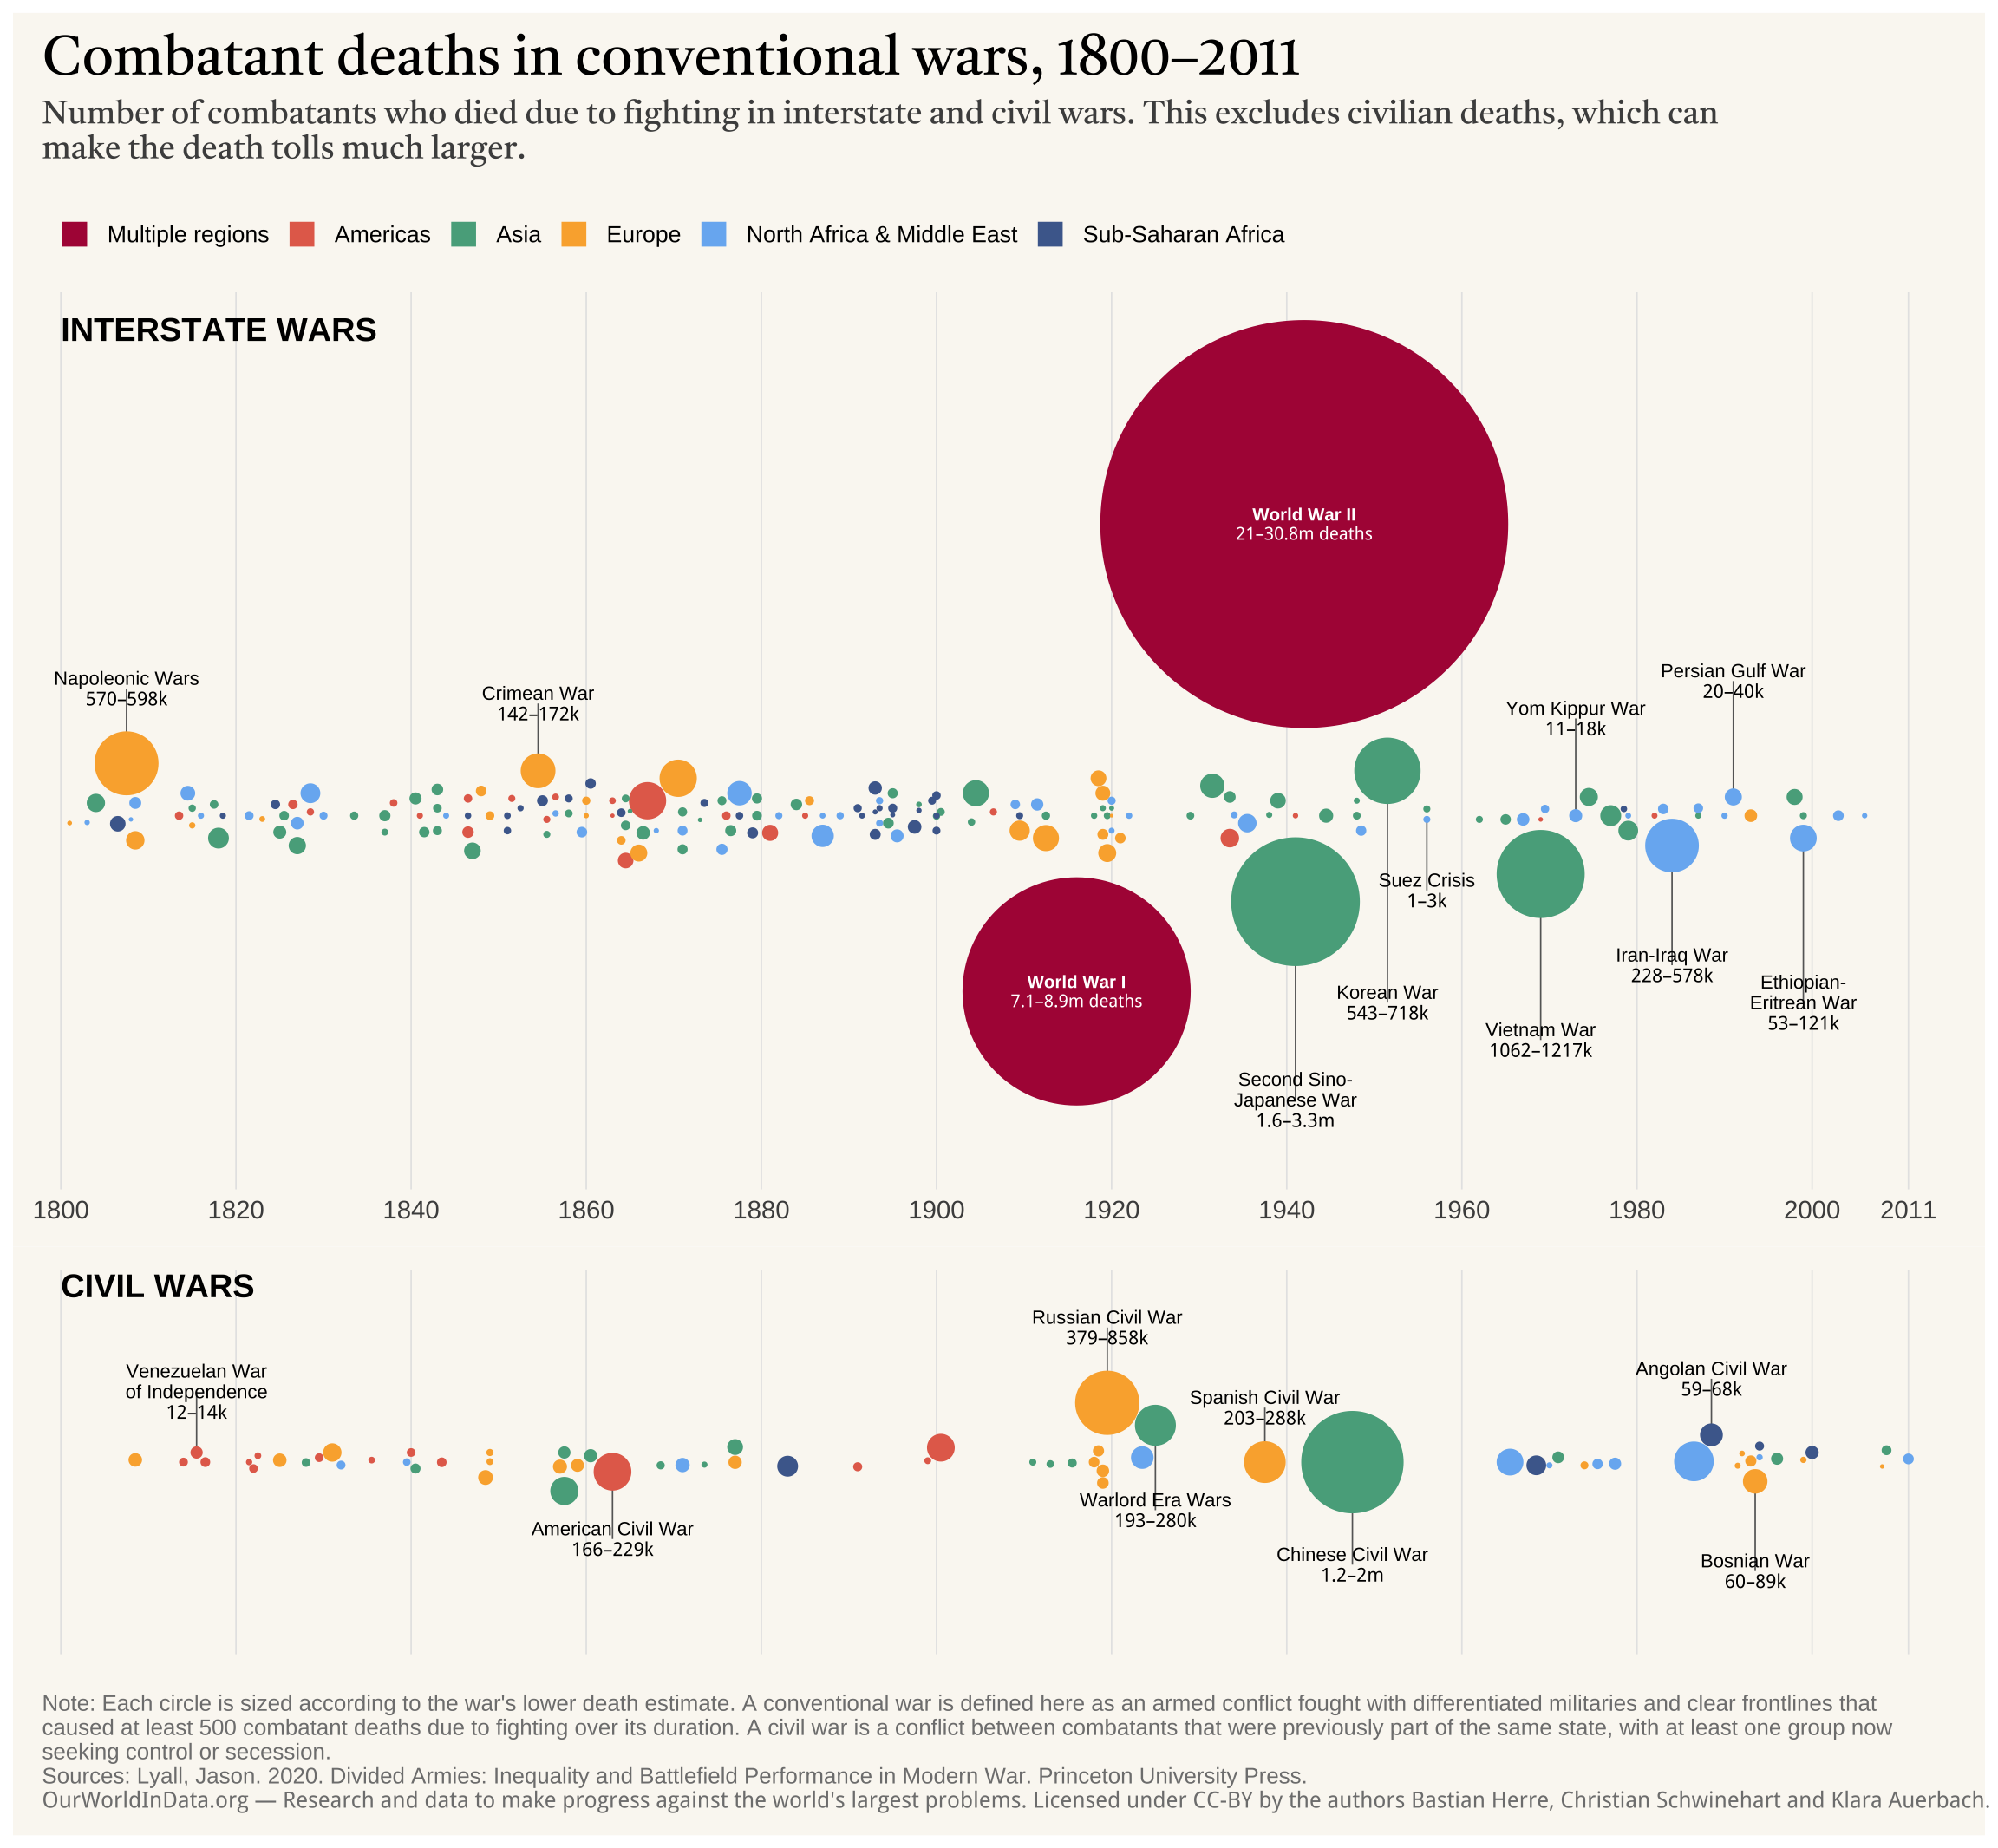
Graph Improvement
Data Preparation
# calculate average deaths from low and high estimates
data <- data |>
  mutate(
    avg_deaths = (war_deaths_low + war_deaths_high) / 2,
    deaths_thousands = avg_deaths / 1000,
    deaths_millions = avg_deaths / 1000000,
    war_type = ifelse(civil_war == "Civil war", "Civil war", "Interstate war"),

    # recode regions
    region = case_when(
      region == "Americas" ~ "Americas",
      region == "Asia" ~ "Asia",
      region == "Europe" ~ "Europe",
      region == "North Africa and Middle East" ~ "North Africa\n& Middle East",
      region == "Sub-Saharan Africa" ~ "Sub-Saharan Africa",
      TRUE ~ region
    ),

    # fix incorrect naming
    war_name = ifelse(war_name == "Third Sino-Japanese War",
                      "Second Sino-Japanese War",
                      war_name)
  )
Create the Plot
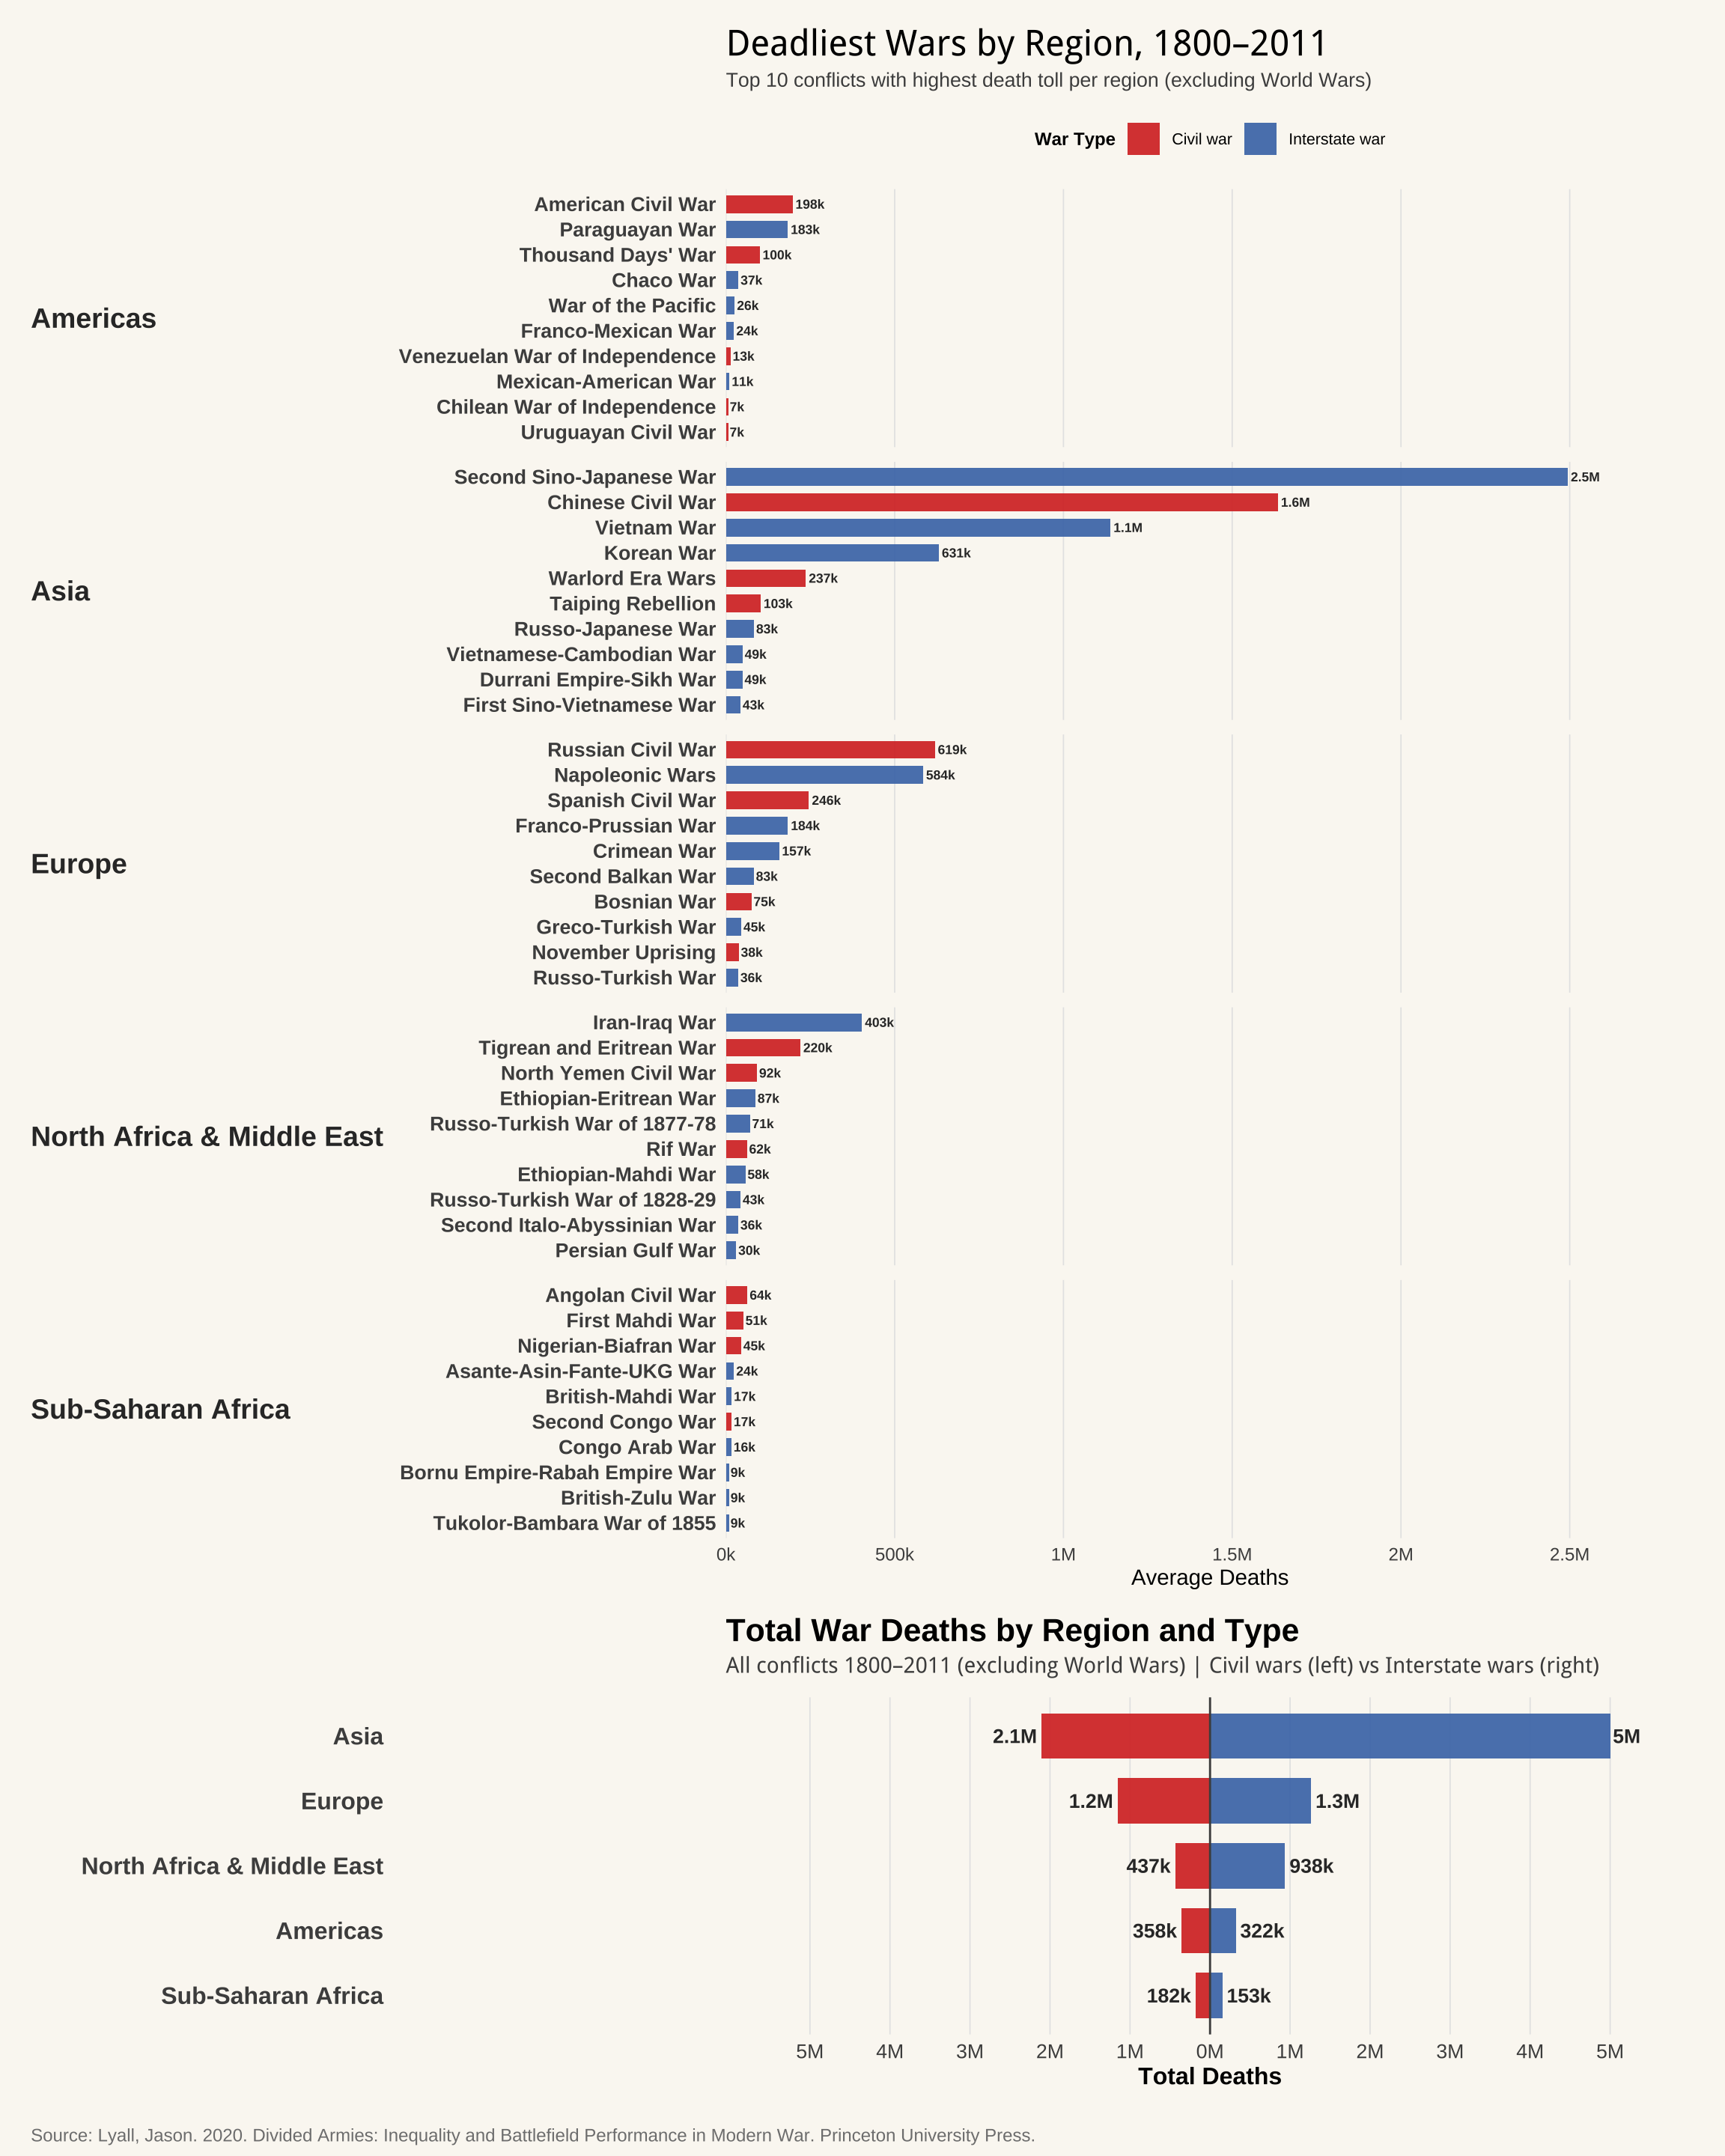
# UPPER CHART: select top 10 deadliest wars per region (excluding World Wars)
top_wars_by_region <- data |>
  filter(!war_name %in% c("World War I", "World War II")) |>

  # remove other second sino-japanese war
  filter(!(war_name == "Second Sino-Japanese War" & avg_deaths < 100000)) |>
  group_by(region) |> # top 10 per region
  arrange(desc(avg_deaths)) |>
  slice_head(n = 10) |>
  ungroup()

war_type_colors <- c(
  "Civil war" = "#d73027",
  "Interstate war" = "#4575b4"
)

# plot: bar chart
upper_chart <- ggplot(top_wars_by_region,
                 aes(x = deaths_thousands,
                     y = fct_reorder(war_name, avg_deaths),
                     fill = war_type)) +

  geom_col(width = 0.7, alpha = 0.9) +

  # labels showing death counts
  geom_text(
    aes(label = ifelse(
      deaths_thousands >= 1000,
      paste0(round(deaths_millions, 1), "M"), # when millions "M"
      paste0(round(deaths_thousands, 0), "k") # when thousands "k"
    )),
    hjust = -0.1, # position slightly to the right of the bar's end
    size = 2.3,
    fontface = "bold",
    color = "gray20"
  ) +

  # each region gets its own panel (vertically)
  facet_wrap(~region, scales = "free_y", ncol = 1, strip.position = "left") +

  scale_fill_manual(values = war_type_colors, name = "War Type") +

  scale_x_continuous(
    breaks = seq(0, 2500, 500), # marks every 500k
    labels = function(x) {
      ifelse(x >= 1000,
             paste0(x / 1000, "M"),  # "M" if > = 1000k
             paste0(x, "k"))  # keep as "k" otherwise
    },
    expand = expansion(mult = c(0, 0.15))
  ) +

  labs(
    title = "Deadliest Wars by Region, 1800–2011",
    subtitle = "Top 10 conflicts with highest death toll per region (excluding World Wars)",
    x = "Average Deaths",
    y = NULL
  ) +

  theme_minimal() +
  theme(
    panel.background = element_rect(fill = "#faf8f2", color = NA),
    plot.background = element_rect(fill = "#faf8f2", color = NA),
    panel.grid.major.y = element_blank(),
    panel.grid.minor = element_blank(),
    panel.grid.major.x = element_line(color = "gray90", linewidth = 0.3),
    strip.text.y.left = element_text(size = 14, face = "bold", color = "gray20", angle = 0,
                                      hjust = 0, margin = margin(l = 0, r = 5)),
    strip.background = element_rect(fill = NA, color = NA),
    strip.placement = "outside",
    panel.spacing.y = unit(0.5, "lines"), # spacing between facets
    axis.text.y = element_text(size = 10, face = "bold"),
    axis.text.x = element_text(size = 9),
    plot.title = element_text(size = 18, face = "bold", margin = margin(b = 5)),
    plot.subtitle = element_text(size = 10, color = "gray30", margin = margin(b = 10)),
    legend.position = "top",
    legend.box = "horizontal",
    legend.title = element_text(size = 9, face = "bold"),
    legend.text = element_text(size = 8),
    plot.margin = margin(10, 10, 5, 5)
  )

# BOTTOM CHART: calculate TOTAL deaths per region and war type
regional_summary <- data |>
  filter(!war_name %in% c("World War I", "World War II")) |>
  group_by(region, war_type) |>
  summarise(
    total_deaths = sum(avg_deaths),
    n_wars = n(),
    .groups = "drop"
  ) |>
  mutate(
    # civil war values are negative so they extend LEFT
    deaths_millions = ifelse(war_type == "Civil war",
                             -total_deaths / 1000000,
                             total_deaths / 1000000)
  )

# calculate total per region for ordering
region_totals <- regional_summary |>
  group_by(region) |>
  summarise(total = sum(abs(deaths_millions)), .groups = "drop")

bottom_chart <- ggplot(regional_summary,
                      aes(x = deaths_millions,
                          y = fct_reorder(region, abs(deaths_millions), .fun = sum),
                          fill = war_type)) +

  geom_col(alpha = 0.9, width = 0.7) +

  # vertical line at center
  geom_vline(xintercept = 0, color = "gray30", linewidth = 0.5) +

  # labels for civil wars (left side)
  geom_text(
    data = regional_summary |> filter(war_type == "Civil war"),
    aes(label = ifelse(
      abs(deaths_millions) >= 1,
      paste0(round(abs(deaths_millions), 1), "M"),
      paste0(round(abs(deaths_millions) * 1000, 0), "k")
    )),
    hjust = 1.1, size = 3.5, fontface = "bold", color = "gray20"
  ) +

  # labels for interstate wars (right side)
  geom_text(
    data = regional_summary |> filter(war_type == "Interstate war"),
    aes(label = ifelse(
      deaths_millions >= 1,
      paste0(round(deaths_millions, 1), "M"),
      paste0(round(deaths_millions * 1000, 0), "k")
    )),
    hjust = -0.1, size = 3.5, fontface = "bold", color = "gray20"
  ) +

  scale_fill_manual(values = war_type_colors) +

  # custom x-axis to show absolute values
  scale_x_continuous(
    labels = function(x) paste0(abs(x), "M"), # show all values as positive
    breaks = seq(-5, 5, 1),
    limits = c(-5.5, 5.5)
  ) +

  labs(
    title = "Total War Deaths by Region and Type",
    subtitle = "All conflicts 1800–2011 (excluding World Wars) | Civil wars (left) vs Interstate wars (right)",
    x = "Total Deaths",
    y = NULL
  ) +

  theme_minimal() +
  theme(
    panel.background = element_rect(fill = "#faf8f2", color = NA),
    plot.background = element_rect(fill = "#faf8f2", color = NA),
    panel.grid.major.y = element_blank(),
    panel.grid.minor.x = element_blank(),
    panel.grid.major.x = element_line(color = "gray90", linewidth = 0.3),
    axis.text.y = element_text(size = 12, face = "bold"),
    axis.text.x = element_text(size = 10),
    plot.title = element_text(size = 16, face = "bold", margin = margin(b = 5)),
    plot.subtitle = element_text(size = 11, color = "gray30", margin = margin(b = 10)),
    axis.title.x = element_text(size = 12, face = "bold"),
    legend.position = "none",
    plot.margin = margin(10, 10, 10, 10)
  )

# using patchwork to stack the two plots vertically
final_plot <- upper_chart / bottom_chart +
  plot_layout(heights = c(4, 1)) + # upper plot 4 times taller than bottom plot
  plot_annotation(
    caption = "Source: Lyall, Jason. 2020. Divided Armies: Inequality and Battlefield Performance in Modern War. Princeton University Press.",
    theme = theme(
      plot.caption = element_text(size = 9, color = "gray50", hjust = 0, margin = margin(t = 10)),
      plot.background = element_rect(fill = "#faf8f2", color = NA)
    )
  )

final_plot